CrazyEgg.com Heatmap Tool Pricing, Features and Review
I recently posted a long and detailed article about the importance of heat-maps for improving user experience.
I used the tool called CrazyEgg to get the heat map for this blog. This is a detailed review of the features and pricing of CrazyEgg heatmap tool.
CrazyEgg Pricing
CrazyEgg provides a 30 day free trial of their service and to activate it you would need a working international credit card. They will check if the credit card is active and they will start your trial.
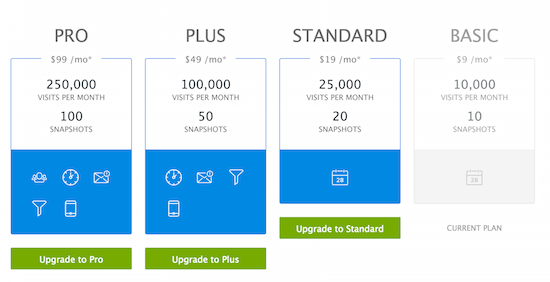
You will not be charged anything upfront. But if you do not cancel your account, your recurring billing will be $108 a year or $9 a month effectively. In the basic plan you will be able to track and get data for 10 different pages.
There are bigger plans too, but the basic plan should be enough for a blogger. All plans are billed annually.
Video Review
I have created video explaining CrazyEgg.
Installing Tracking Code
The first step after you register would be to add a new snapshot. A snapshot means a new page which you want to track using CrazyEgg.
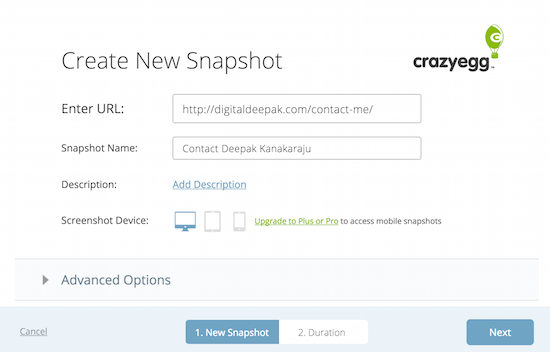
After you create the snapshot, you will have to install a Javascript code on the page on which you want to start tracking. If you are using WordPress, you also have the option to install the code using a plugin. Alternatively you can add the code along with the Google analytics code in your theme’s settings.
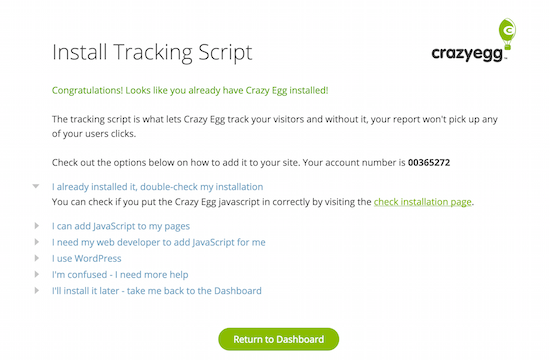
I just took the JS code and put it on my theme’s option for installing tracking scripts – now it loads on all the pages and hence I will be able to track any page I want to.
CrazyEgg Features and Review
Now that we know about the pricing of CrazyEgg and how to install the tracking code, let us review the features of CrazyEgg.
Once you have added the pages, here’s how your dashboard will look like:
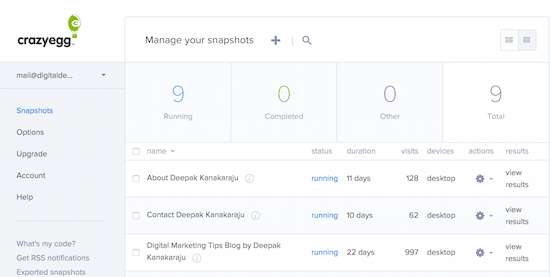
You can click on view results to get more insights into a specific page. I would recommend waiting until a page gets at least 500 visits, so that you can get some actionable insights from the reports.
Anything less than 500 visits, the sampling size will be too low and you will not be able to make lasting decisions using the data.
Heat Maps
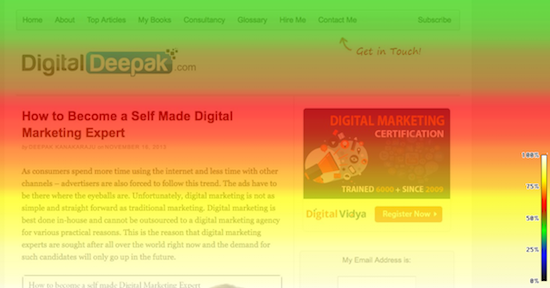
Once you click on the view results link for a specific snapshot, you will be taken to a page like the one below. By default you will see the Heat map. According to CrazyEgg:
The heatmap is a visualization of where your visitors are clicking. The brighter the area, the more popular it is. The darker the area, the less popular it is. As a specific area of your site gets more clicks, its color on the heatmap will change.
The following is the heat map for a specific article on my website. I can see where people are clicking when they visit this page.
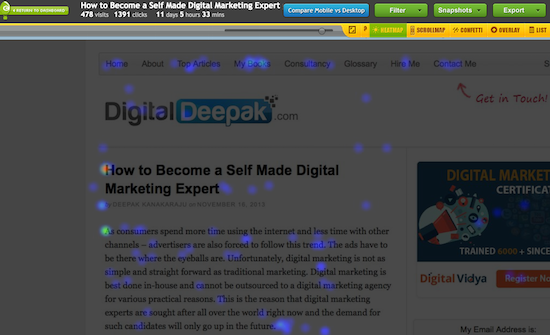
Heat map shows you the ‘hot’ and ‘cold’ areas but it will not show you the number of clicks each link received. To know the number of clicks received, you have to open the Overlay report which is explained below.
Scroll Maps
Scroll maps show you the pattern of scrolling that happens on your website. When visitors scroll your page, they spend more time in certain sections of the website and less time in other sections.
The scrollmap shows the number of times each part of the page was visible through a browser window. Bright areas received a greater number of impressions, dark areas were viewed less often.
Here’s a scroll map from my website:

The lightest (hottest) area are viewed more and the darker areas are viewed less. If you have a landing page, tracking where users are spending more time will give you a lot of insights about what content performs well and what doesn’t. Scroll maps are one of the best features of CrazyEgg.
Confetti Maps
Confetti maps will show you the clicks from different referral sources. Each referral source is marked by a different colour and it helps you gauge the performance of different traffic sources. Here’s a confetti map for my website:
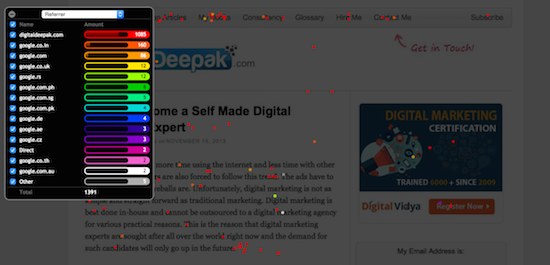
Here you can see that the pattern of clicks coming from direct traffic is different and the clicks from from the search engines are concentrated in a different areas. You can also switch off and on specific referral sources to get a clearer idea about the click patterns.
Overlays
Heat-maps will show you the intensity of clicks in specific areas of your website but it doesn’t show you the number of clicks received on each link. Overlay maps will show you the number of clicks that each link has received. Here’s the overlay map for my site:
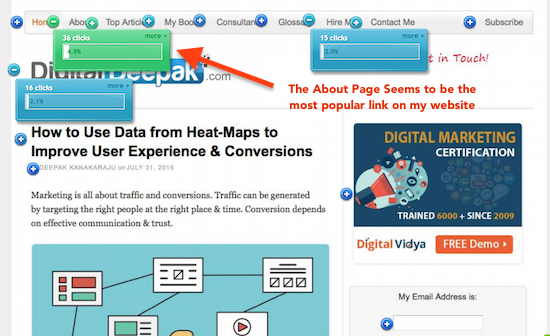
This map doesn’t show where my visitors clicked on but it clearly shows which link was clicked on. I can see that the About page is the best performing link on my website with around 5% of the visitors clicking on it.
Overlay report is a feature that is not exclusive to CrazyEgg. There are many other tools including Google analytics which can show you overlay reports. We will discover more in the future posts.
Conclusion
If you are a blogger, webmaster or UX designer, you will find CrazyEgg extremely useful. I was able to make some intelligent changes on my website using the data from these maps.
I will be reviewing other heat-mapping tools and also compare it with CrazyEgg. The next post will be CrazyEgg vs. ClickTale.
Any questions on this review of CrazyEgg? Leave a comment below.