Create Custom Google Data Studio Reports for Facebook Ads

Do you ever get frustrated when your marketing campaign does not do well, and you have no idea why? The most challenging aspect of a marketing campaign for most marketers is measuring the campaign’s success, which is in the form of analytics.
The analytics, especially the dashboard seems quite scary. There is too much data, and by the time you make sense of it, you are already done for the day. It is not enough that you get the data; you need to interpret it so that you can show it to your clients as well.
Google Data Studio, which is still in the beta version, has made life easy for the marketer. It helps visually interpret the data and makes the work for SMBs as well as the marketers way easy.
All the information is translated into easy to interpret reports via data visualization. You are not only able to interpret the data but also able to visualize the data and get real-time insights that help you take immediate decisions.
Apart from the Google analytics data, you can even pull data from Facebook into the Google sheet for detailed analysis. This tool allows you to pull data from wherever you need, and it automatically creates easy to comprehend reports that you can analyze.
So, let’s understand how the data studio can help you understand how your ads are performing, and what needs to be done to improve them.
Before that, we will understand why you need data studio for Facebook?
- There are numbers, and there is a whole set of data available with you that dictate the performance of the ad.
- If you want the cost per impression versus results, and you want a graph that will help you understand the data better, what is the first step you need to take? You will need to download the data that is available with you, pull it into an excel sheet, and then go on to create the graphs that are necessary to represent the data.
- With Google data studio, you don’t need to dig into the data and create the graphs each time the data is updated. The studio will update the data in real-time and give you an updated graph each time the data changes.
We will be creating a data studio for Facebook ads from scratch. Let’s get started, shall we?
Step 1: Create a Data Source
You need to create a data source to monitor Facebook ads via data studio.
Visit the data sources page on Google data studio.
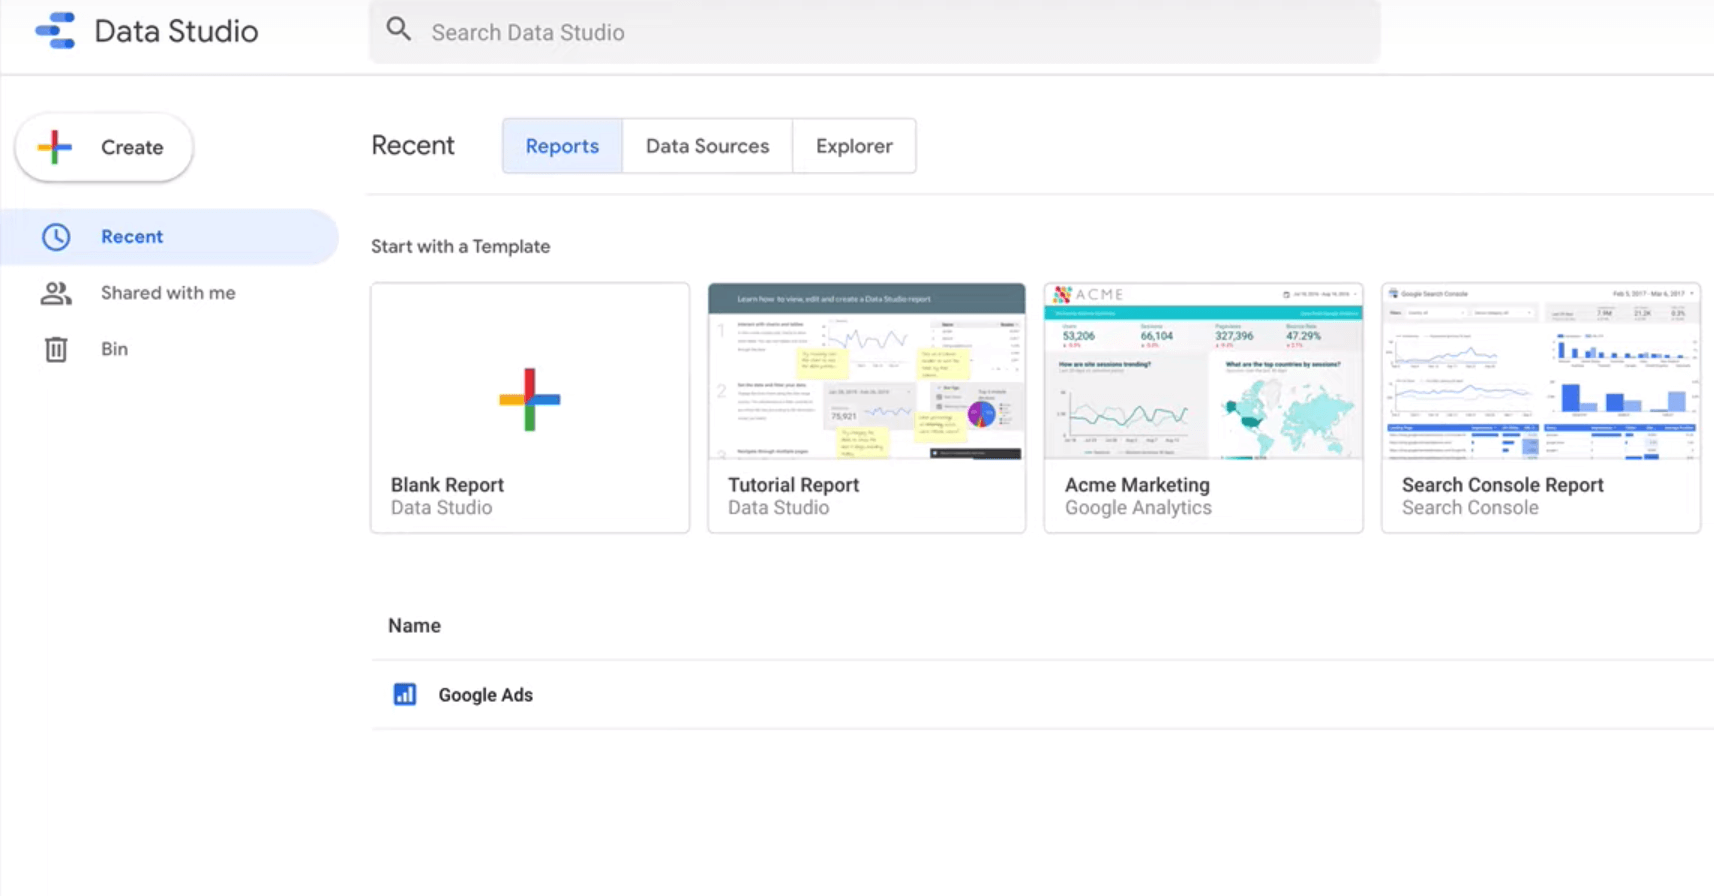
Click on the + sign here. You will see the connectors page. Here you need to choose the partner connectors dropdown, search for Facebook, and pull the data from the Facebook ads manager to the data studio.
To connect Facebook ads with the data studio, you will need to visit the Supermetrics site. This site allows you to create up to three ad accounts for free. You can always look for the plans available. There are some premium aspects to the account but, that needs to be checked.
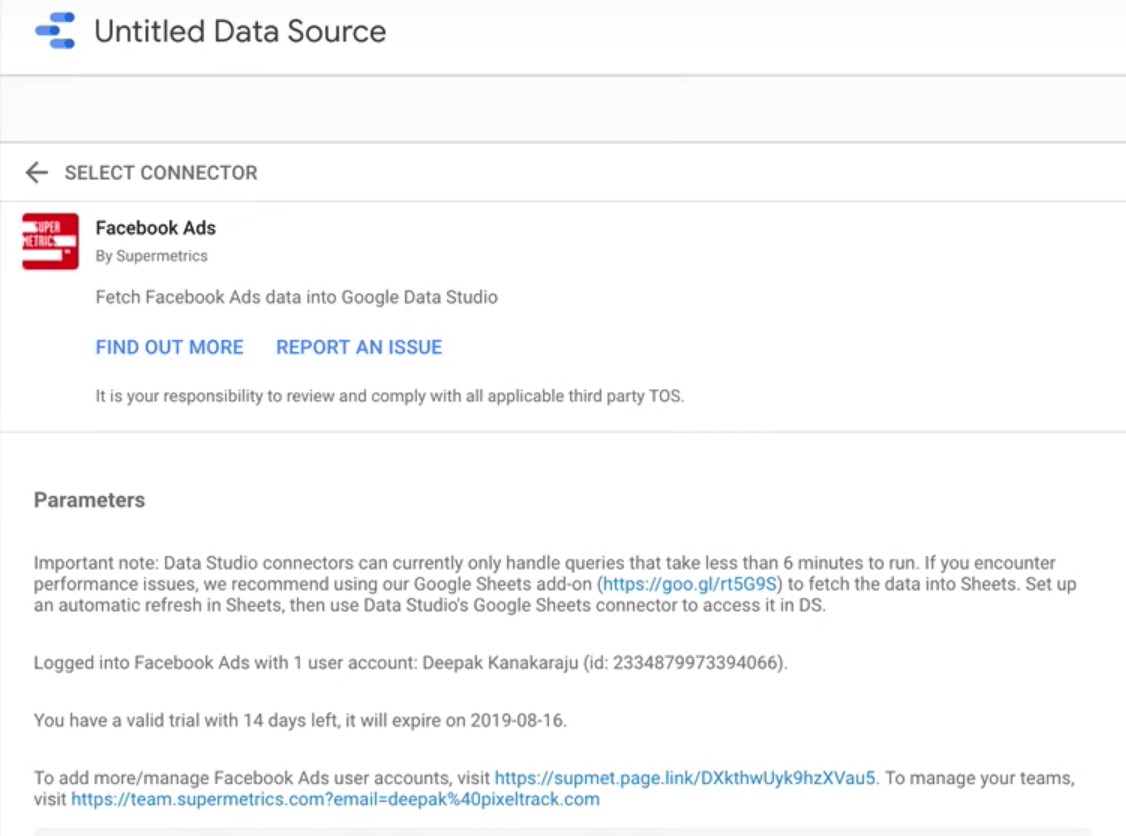
Now that you have connected via Supermetrics, go back to the partner connectors, search for Facebook via Supermetrics, and connect it.
If this is the first time, which is the case, you will need to connect to your Facebook account to get started.
The best part of using Supermetrics is that you can always add or manage multiple Facebook accounts via this method.
Once Facebook is connected, you need to select the ad account that you have connected with Facebook to manage via the data studio.
You will need to select the reporting time zone too at this point.
Once this is done, you will get the data that you have received into Google data studio from Supermetrics.
Step 2: Build a Chart Using Supermetrics
Once you have the data, you should go to the data studio dashboard to get started with creating the chart. Here, you will see the connector setup which will help you build the analytics data.
You will also get a default template from Supermetrics, which will be built using the data that the data studio has received from your Facebook ads.
The default data can be revised and customized to suit your needs or you can start creating a brand-new chart, from scratch.
If you want to create a brand-new data studio report, here’s how you need to go about it.
Click on the blank report. You can even rename the report that you have just created.
The data source for this report is going to be Facebook ads. Once you have set up the data ads, you might need to add the Google analytics data source as well.
You can select the theme for your charts. You can go with a simple theme or something more intense and attractive for your charts.
Now you need to add the details to your charts. Start with the date selector and move to the logo. Once the template for the chart is ready, you can save it, and start with the actual chart building exercise.
You need to select the type of chart you want to create using the data studio. Once you have that in mind, you can get data studio to do the work for you.
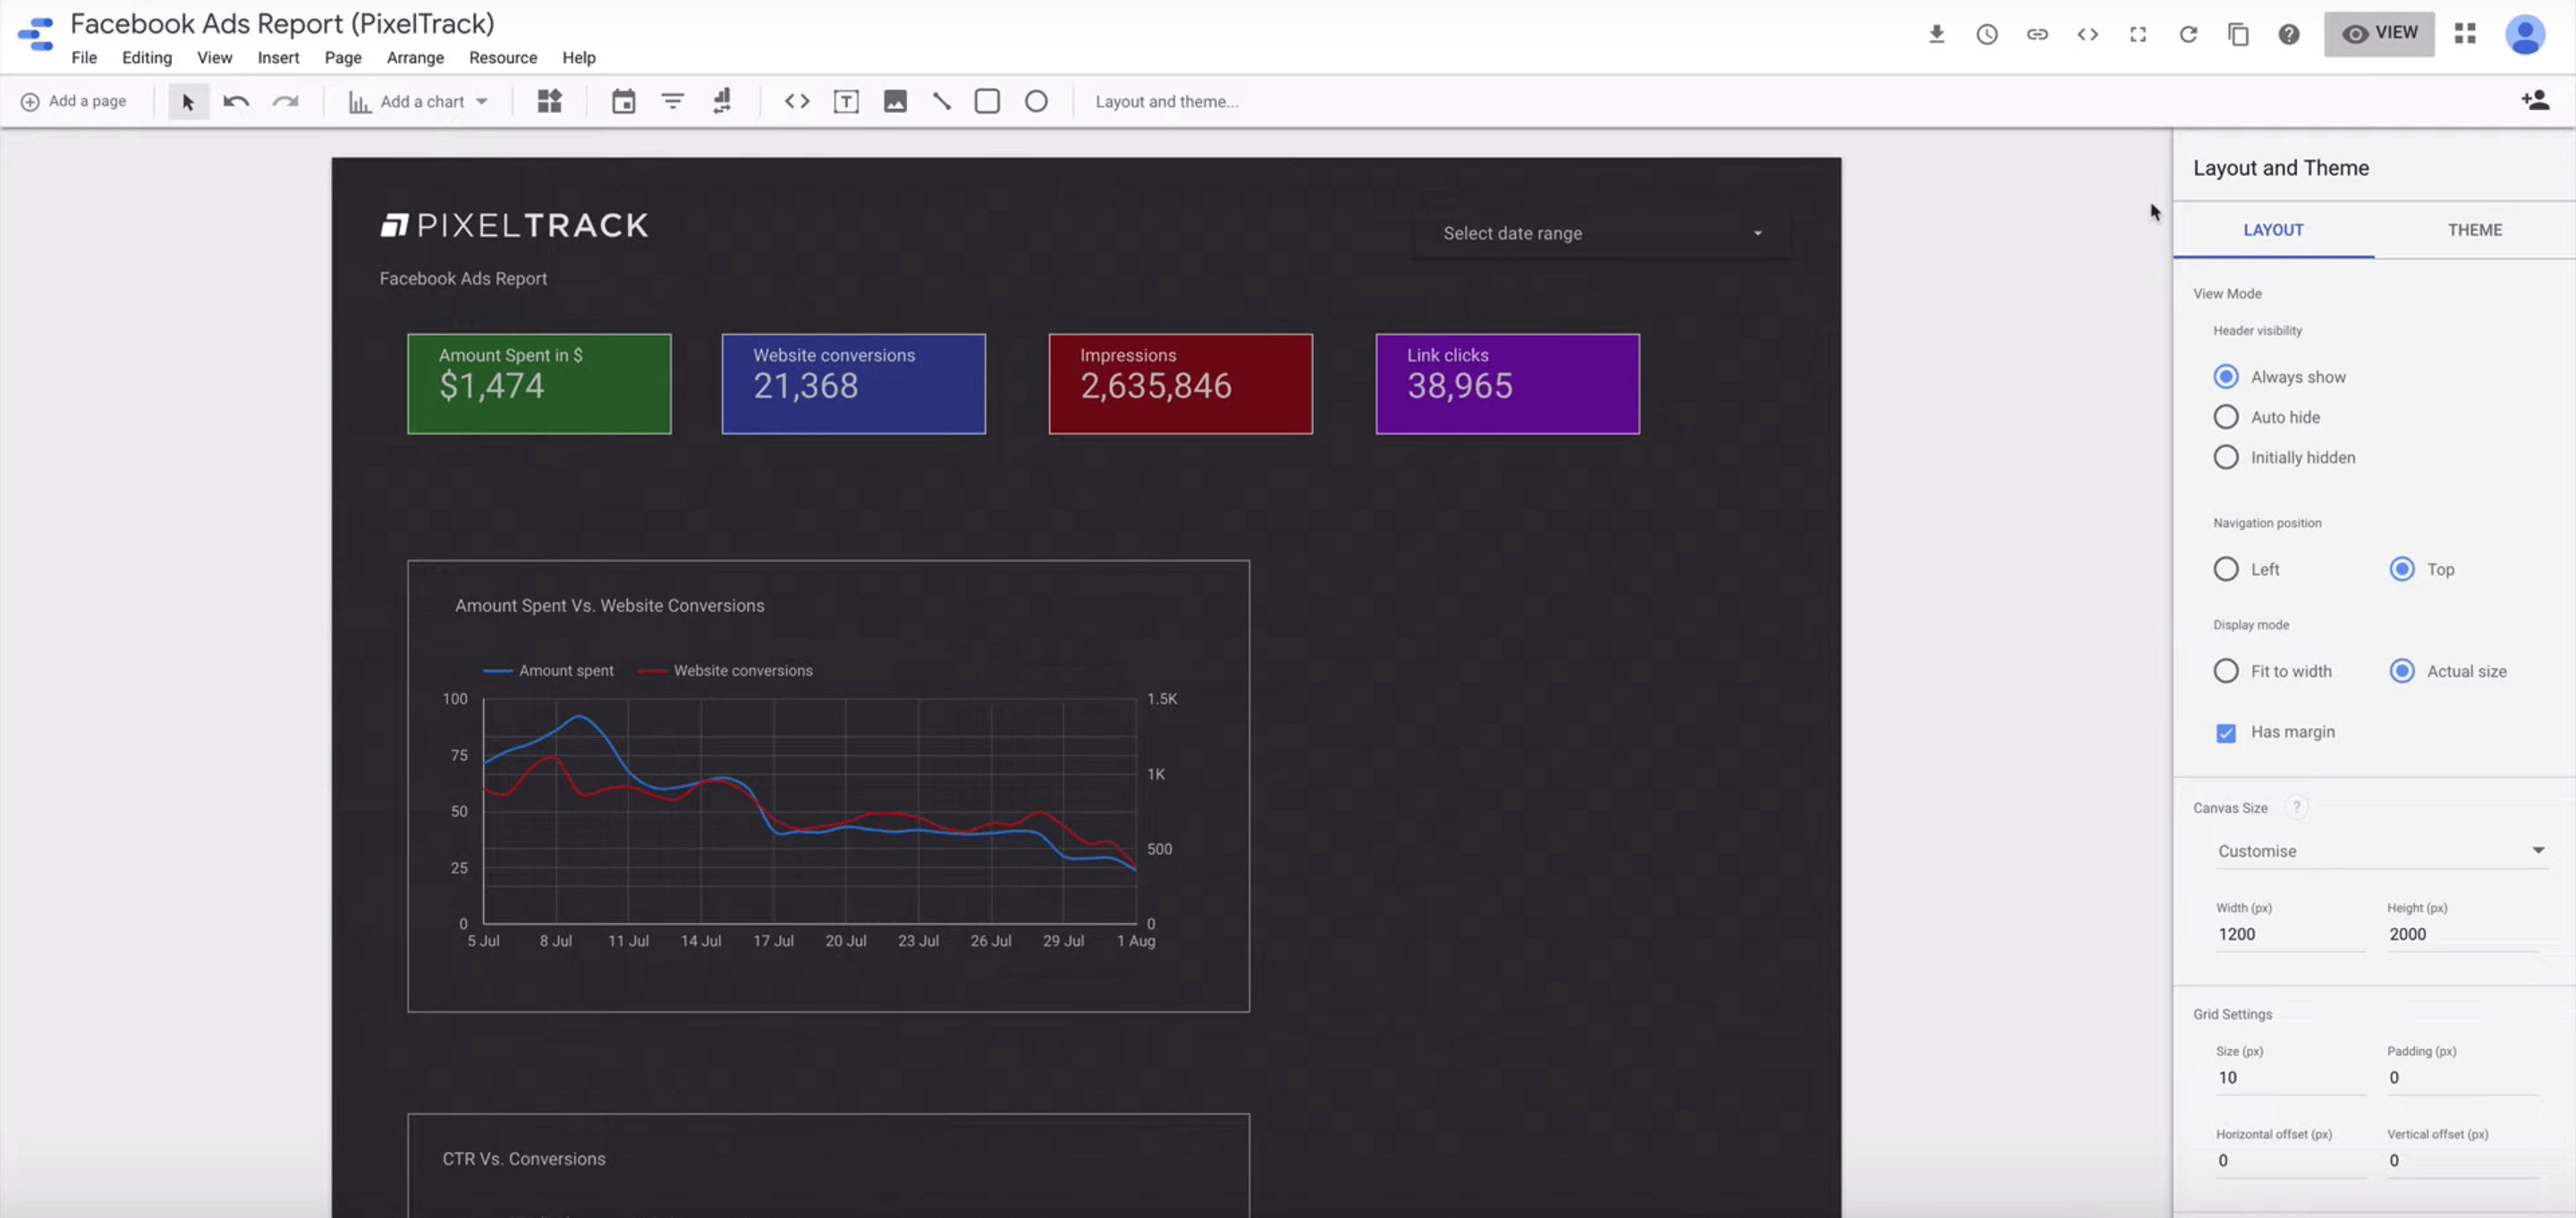
The time series chart is the first example that we go with. You add the time series chart, add a date range to that. The default for this chart is impressions. You now need to select what it is that you need the chart to showcase. In this case, we want it to show the daily budget and conversions. You choose the data from the available fields and add it to the metrics.
When you are defining the chart, make sure to choose the things you want to compare on the different axis so that it becomes easier for you to view. For instance, if you want to check the amount spent versus the conversions, then you ought to place the amount spent on the X-axis, and the conversions on the Y-axis.
You can now customize the settings according to your choice. You can change the chart type from line chart to bar chart. You can smoothen the edges or change the colors and fonts for the charts.
You can keep adding or deleting the factors that you need for the creation of the data charts. The best part is that now you have an active Google sheet, wherein you can add or delete the data in real-time, and every action is noted in the sheet.
Once the data studio account is created, you don’t need to login to Facebook to check the trends, every single time.
Here are a few things you can do with the data studio:
- You can download it as a PDF, and keep it as a record
- You can easily share it with the clients, making the whole analytics easy for you
- Every time and you want to see the new data set, then you need to add the plugin data studio auto-refresh.
You need to set up the timer, and you can easily see the latest data appear each time you view the datasheet. It is more like the Statista or other reports. Some companies even have it displayed on the screen through a projector so that they can stay updated with the numbers.
Step 3: Analyze Multiple Campaigns
If you are running multiple campaigns, then it is important to pull the data for a particular campaign, before moving ahead with the actual data analysis. When you are creating the chart, add the campaign for which you need to pull the data. Once that is done, the data studio will get the data for the campaign.
- Select the filters that you want to apply to the campaigns that you have set.
- Once the filters are set, your graphs will ready eventually.
You can keep creating reports for the individual campaign or opt for a campaign selector and choose the data sources for a particular campaign.
Step 4: Data Settings to Know
When you are analyzing the Facebook ads data, there are a few data settings that you ought to know.
- Set the metric for the particular ad, which will help you measure the success or the failure of the ads
- Determine how you want to organize the data for the particular ad campaign
- What time period you want to compare for the ad campaign that you have initiated. For instance, do you want a month-long tracking to be done or, do you want to track for a particular week or day?
- Filters for the campaign need to be decided, as that will help you know what aspects have led to its success
Summing up
Managing Facebook ad campaigns involves analytics and visualization of the metrics for better insights and informed decisions making. With Google data studio, you get a chance to visualize how your ad campaigns look and improve your results through a detailed analysis of the metrics. You will know what factors to improve, where to reduce your budget, and if the ad campaign is effective or not.
You can manage multiple campaigns using a single account, and you don’t need to crunch numbers manually. With this go-to method, you should be able to do a thorough analysis and impress your clients with detailed reports every single time.